Simple Python SDI-12 logging scrip

In case you wish to integrate the SDI-12 USB adapter into your existing Python script, here I provide a simple script to demonstrate how to get data. You can also use this script as a spring board to establish serial port communication in Python for anything else, such as talking to Arduino.

The goal is to not complicate things with the full-feature data logger script. You’ll see that the actual data logging only needs a few lines of code:

Simple sensor detection and reading (2018-12-03)

This script demonstrates how to integrate SDI-12 sensors into your existing Python data logging system by providing the minimal necessary features. It MUST run with a single sensor on the bus. For full-featured logging script, download the Data Logger script.

I’ll keep this script together with all my other scripts and provide updates to it when necessary. I’m also considering writing simple scripts for other programming languages. Do you wish to use the SDI-12 USB adapter with a programming language other than Python? Leave me a message here.
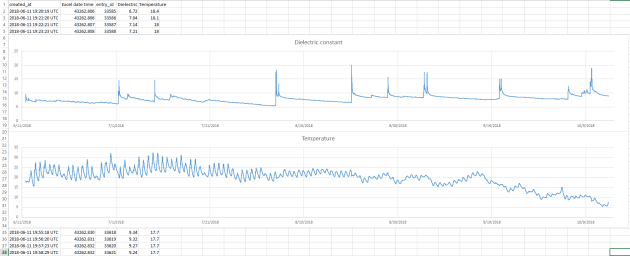
2018 5-month SDI-12 USB adapter run

I conducted a long run (5 months) on an SDI-12 sensor with a raspberry pi zero in the months of June to October to test the long-term stability of my data logging solution. I was using a regular SDI-12 USB adapter, a Decagon/METER Group soil sensor model 5TM with dielectric constant and temperature sensors and I buried it in my back yard. Over 100K data points later, the ground was freezing and I unearthed my sensor and stopped the feed. Here is an overview of the data feed. Please click the plot to see a full-size screen grab.

The top plot is dielectric constant. Each spike represents a major rainfall in my area that made the electrical conductivity of the soil shoot up and then gradually die down. Each small step is when I turned on my sprinkler system to water my lawn (smaller than the spikes but still significant within a range of a few days).

The bottom plot is ground temperature, about 20 cm in the soil. The diurnal temperature variation is greater during the summer than during the fall, as represented by the larger amplitude oscillations of temperature at the beginning of the graph and the gradual reduction of oscillation amplitudes towards the end of October.

Despite of a number of power outages (can you even see them from the graphs?), the system worked flawlessly, restarting when power was restored. In retrospect, I should have invested in a backup battery such as this one:

https://www.amazon.com/gp/product/B01M7Z9Z1N/ref=oh_aui_detailpage_o02_s00?ie=UTF8&psc=1

It is charged by a 12V ac adapter and provides 5V power on its USB port. When the ac power is out, it uses its internal battery to continue to provide 5V power. For a small system such as raspberry pi zero, it could power it for hours.

If you wish to see the complete data set, here is the link to download:

https://www.dropbox.com/s/4sry1pqwp9hdxuo/2018%20summer%20fall%20lawn%20data%20feeds.xlsx?dl=0

For more information on the SDI-12 adapter and data logging scripts, go to their dedicated page here:

SDI-12 USB adapter